

International Import and Export Data Platform Unlocks Global Trade Opportunities
2026-08-17
Trade data used to sit in customs warehouses and dusty spreadsheets. Not anymore. Tendata has turned millions of shipping records into a live feed of who's buying, what they're paying, and where the next opportunity is hiding. If you've been chasing leads with a decade-old contact list, this post might change how you find your next market.
Find companies already paying to bring in your type of product
Zero in on businesses that already allocate budget for your exact product category—these are the buyers who've validated demand with real dollars, not just casual interest. Scan trade journals, import records, or industry directories to spot repeat purchasers of similar goods. Their past spending tells you they're not window shopping; they have an operational need and a procurement process in place.
Don't chase companies that only browse or request samples without follow-through. Instead, look for telltale signs of committed sourcing: long-term supplier agreements, frequent replenishment orders, or public tenders for your type of item. These organizations have already cleared internal hurdles like budget approval and vendor vetting, which means your pitch can skip straight to why your product edges out their current supplier.
Use tools like customs data platforms, wholesale marketplaces, or even LinkedIn posts from supply chain managers asking for quotes. A company actively paying to bring in your product category is a far warmer lead than one that merely fits a demographic profile—target them first and tailor your outreach around what they already buy, how often, and at what volume.
Country-by-country demand shifts that rarely make the news
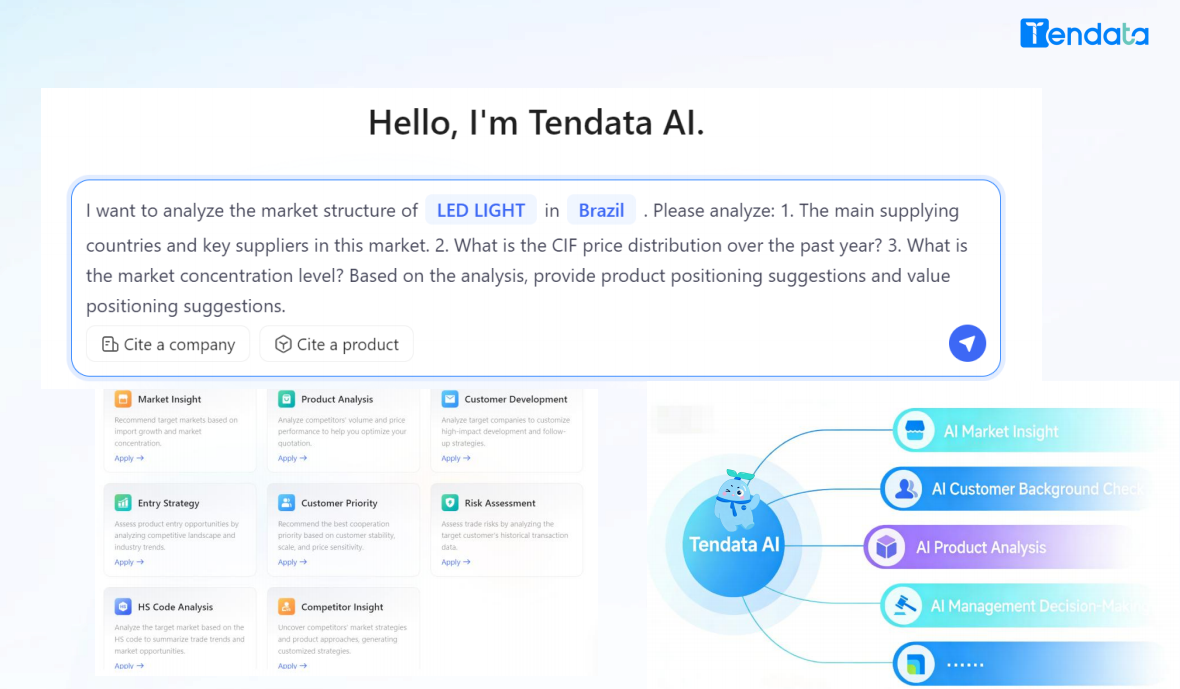
Most coverage of energy or commodity demand leans on broad regional averages, but the details that actually move markets often sit inside single countries. A cold snap in northern Italy might push gas storage drawdowns faster than official forecasts, while unseasonably mild weather in the U.S. Midwest leaves propane inventories stubbornly high. These isolated mismatches rarely earn a headline because they do not involve a dramatic supply failure—just a slow, uneven recalibration of what buyers need week to week.
The same quiet divergence shows up in food and industrial inputs. One country may suddenly import more palm oil after a shift in local biofuel blending rules, while a neighboring market cuts back because importers are waiting for lower prices. None of these moves are large enough to trigger exchange-limit moves, but together they redirect vessel schedules, alter freight rates on smaller routes, and force traders to reprice physical premiums long before official statistics confirm the trend.
Tracking these shifts requires reading port data, utility submissions, and trade chatter rather than waiting for monthly reports. By the time an agency publishes revised demand numbers, the adjustment has often already passed through cash markets. The countries that matter most are not always the largest consumers; they are the ones where a small imbalance can tighten a regional supply chain faster than anyone expects.
Why shipment volume says more than a supplier's own brochure
When a brand's own brochure lists a conservative shipment figure, it often reflects only the initial production run or a single distribution channel. The actual volume moving through the supply chain can be far higher once you account for unlisted resellers, parallel imports, and restocks triggered by actual sell-through data. Shipment numbers pulled from logistics records include every unit that leaves the warehouse, not merely the ones highlighted in marketing materials.
Another reason for the discrepancy is that brochures are often printed weeks or months before launch, using forecasted quantities that may have been revised upward after stronger-than-expected pre-orders. Meanwhile, shipment data is dynamic, recording each batch as it leaves the facility. If a supplier quietly fulfills a large offline order or ships to a regional hub that later redistributes stock, those units appear in shipment totals but never make it into the glossy brochure.
Finally, shipment volume can include units destined for warranty replacements, demo devices, or partner bundles that the brochure intentionally omits. A supplier's own promotional literature focuses on flagship retail units to keep messaging clean, but real-world logistics count every pallet. That's why shipment volume tells a fuller story than a static brochure ever could.
Product categories quietly crossing borders in higher quantities
Look beyond the usual electronics and apparel, and a quieter shift emerges. Categories like specialty flours, niche condiments, and home repair components are moving across borders in larger volumes than most trade reports highlight. These aren't headline-grabbing goods, but their steady rise points to changing consumer habits and localized supply gaps.
Part of the growth comes from small and mid-sized producers finding cross-border platforms that once favored only large exporters. A maker of smoked paprika in Spain can now reach steady buyers in Poland or Canada without massive logistics investments. Similarly, replacement parts for older appliances or specialty fasteners flow more freely as repair cultures spread and bigger retailers cut back on low-margin inventory.
Tariff adjustments and regional trade agreements quietly lubricate some of these increases, but so does simple demand for authenticity and durability. A sauce from one specific town, a gasket that fits a twenty-year-old machine, a flour blend for a regional bread—these are not glamorous, yet they keep crossing borders in higher quantities, reshaping what 'global trade' actually looks like on the ground.
Freight route comparisons that reveal cheaper market entry
Most shippers fixate on the headline ocean rate between two major ports, but that figure hides the true cost of entering a new market. Pull actual quotes for multiple lanes—say Shenzhen to Rotterdam versus Shenzhen to Gdansk, or Ningbo to Lazaro Cardenas instead of Long Beach—and the gaps start to show. A route that looks cheap on paper often turns expensive once inland trucking, customs brokerage, and demurrage are added. Four extra days of container detention at a congested terminal can wipe out the entire ocean freight saving.
Comparing routes also uncovers backdoor entries into price-sensitive regions. Shipping into a secondary port and finishing the move by rail or barge can undercut the direct ocean route by 15 to 20 percent, even after extra handling. The key is to request quotes for three or four port pairs at the same time, not one after another. Forwarders who know they are being compared tend to stop padding the inland portion of the rate.
A practical way to build the comparison is to pull rate sheets from at least two forwarders and one digital platform, then normalize everything by total landed cost per kilogram or cubic meter. Include fuel surcharges, peak season add-ons, and the cost of capital tied up in longer transit. Often the cheaper market entry point is not the obvious gateway port but the lane where scheduled reliability is high enough to cut safety stock instead of paying for faster transit.
Building a shortlist of buyers from weekly customs updates
Weekly customs updates can feel like drinking from a fire hose, but the trick is to treat each shipment record as a lead that needs qualifying, not a final answer. Start by filtering for consistent importers of your product category over the last four to six weeks, then cross-reference shipment frequency and volume against the buyer's declared business scope. That simple habit turns noise into a working list.
Once you've spotted repeat names, dig into their sourcing patterns. A buyer who switches suppliers every few months might be price-driven, while one with steady relationships but expanding volumes is often ready for a backup or a better fit. Mark those with moderate order sizes and a clear need for your region's strengths, then set aside the ones with erratic records or mismatched ports.
Finally, rank the shortlist by actionability rather than size alone. A mid-sized importer with a growing rhythm and an active recent shipment is usually more reachable than a giant with locked contracts. Keep the list to around a dozen names, refresh it weekly, and reach out with a specific reference to their latest customs activity—something that shows you've done the homework without sounding like a bot.
FAQ
You get access to shipment records, customs declarations, and bill of lading details from over 80 countries. That includes both import and export transactions, with buyer and supplier names, quantities, values, and even shipment dates where available.
Instead of guessing which companies might be interested, you can look up who is already importing products similar to yours. Filter by country, product type, or shipment frequency, and you will have a shortlist of potential buyers complete with their trading history.
Most records are refreshed within 24 to 48 hours after customs release, depending on the country. Some regions provide same-day updates, while others lag by a few days, but you will always see a timestamp so you know how fresh the data is.
Raw customs data is messy and full of duplicate entries or missing fields. This platform cleans, standardizes, and enriches the records with company profiles and contact details, so you spend time acting on leads instead of cleaning spreadsheets.
Yes, you can enter a competitor's name and see their shipment history, including volumes, destinations, and carriers. This gives you a realistic picture of their market reach without relying on rumours or outdated reports.
Coverage spans North America, Europe, Asia, Latin America, and parts of Africa. The strongest datasets come from major trading hubs like the United States, China, India, Germany, and Brazil, but new countries are added on a rolling basis.
The interface is available in Spanish, Mandarin, Portuguese, and French, and the support team can handle queries in those languages as well. Data fields like product descriptions often remain in the original language from the customs filing, which can be an advantage for local verification.
Before you commit to a market, you can see who is already importing there, what pricing patterns look like from declared values, and how stable the trade flow has been over the past 12 months. That helps you avoid markets with declining demand or inconsistent buyers.
Conclusion
For companies trying to expand internationally, the hardest part is often knowing who is already buying. An import and export data platform changes that by showing actual shipment records, so you can find businesses that are currently paying to bring in products like yours. Instead of guessing which countries might be interested, you see demand shifts as they happen, country by country, including smaller fluctuations that never make headlines. One overlooked insight is shipment volume: a supplier's brochure can make bold claims, but the number of containers leaving a port tells a far more honest story about real market appetite.
Beyond identifying active buyers, these platforms track product categories that are quietly crossing borders in larger quantities—opportunities that many exporters miss because they rely only on traditional market reports. Freight route comparisons then reveal cheaper ways to enter a market, helping you avoid crowded or expensive shipping lanes. Finally, by building a shortlist of buyers from weekly customs updates, you can act on fresh data rather than stale contact lists. In short, this kind of tool takes the guesswork out of global trade and turns raw logistics data into a practical roadmap for growth.
Contact Us
Contact Person: Grace
Email: [email protected]
Tel/WhatsApp: +86 18721992033
Website: https://www.tendata.com